When we talk about recruiting from India, it's easy to think in national averages. But dig into the September 2025 data, and a very different picture emerges, one that highlights the need for a more targeted approach.
India remained the largest recruiting market this September across Enroly partner institutions, accounting for 30% of all CAS issued. Growth was modest overall this September, and the market remains predominantly postgraduate taught (80%) and largely agent-led (81%), with impressively low visa refusal rates overall.
But zoom in by state, and the real story changes.
Growth Hotspots and Where Momentum is Slowing
Several states traditionally considered “safe bets” saw decline. Kerala fell 7.58% YoY for acceptances, while Maharashtra dropped nearly 24.67%. Karnataka and Uttar Pradesh also contracted.
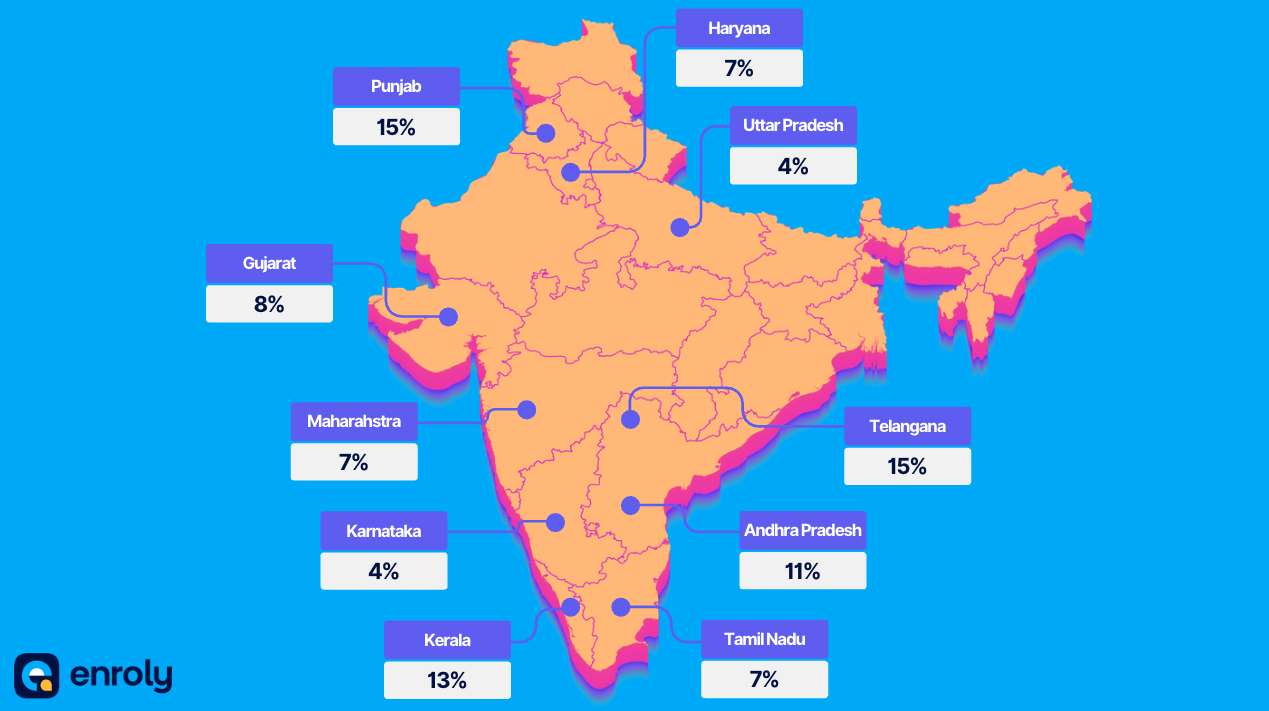
Meanwhile, other regions surged ahead:
- Gujarat: +72.93% acceptances, +76.13% CAS issued.
- Punjab, Telangana, Haryana: strong double-digit growth.
- Tamil Nadu, Andhra Pradesh: steady, positive momentum.
What this means: Growth is concentrating in specific regions and recruitment strategies need to follow that shift.
Conversion Rates Tell a Different Compliance Story
India’s overall acceptance-to-CAS conversion rate is 69%, just below the intake average of 70%. But once you look state-by-state, the differences become clear.
- Lower conversion: Punjab and Haryana both sit at 56%, with Uttar Pradesh at 65%.
- Higher conversion: Tamil Nadu (80%), Maharashtra (84.9%) and Karnataka (83%) show much smoother progression through to CAS.
Punjab is a good example of the nuance. Conversion is still relatively low, but it has improved from 48% last year. So while growth is strong, these northern states remain higher-friction markets when it comes to getting students from acceptance to CAS.
Visa Refusals: Improved, but Still Concentrated in the North
India’s overall visa refusal rate is low at 1.25%, and most major states sit well below this.
Kerala, Andhra Pradesh, Gujarat, Telangana, Tamil Nadu, Karnataka and Maharashtra all recorded refusal rates under 0.75%.
But three states stand out:
- Punjab: 3.09%
- Haryana: 3.64%
- Uttar Pradesh: 3.21%
These figures are still “low” in absolute terms but around three times higher than other large states. The good news is that all three have improved significantly year-on-year, Punjab fell from 7.96% and Haryana from 5.53%.
A clear pattern also emerges by recruitment channel: in seven of the top ten states, direct applicants had higher refusal rates than agent-led applicants, with the gap widest in Punjab and Haryana. For universities recruiting heavily in these markets, especially via direct channels, compliance processes need to be tight
Agent vs Direct: Not All States Play the Same Way
India overall is 81% agent-led, but the reliance on agents varies a lot between states.
How we measure this: The data in this section is based on agents formally linked to students in university systems. It's important to note that there may be "shadow agents" supporting students in the background who aren't captured in this data, meaning the true agent involvement could be even higher.
- Most agent-dependent: Andhra Pradesh (93%)
- Most balanced: Maharashtra (70% agent-led)
The broader agent landscape for September 2025:
- Total agents on the Enroly platform: ~5000
- Active agents in India: Fallen by 9% YoY
- Top 5 agents: Recruit 50% of all students
- Top 10 agents: Recruit 66% of all students
- Agents sending fewer than 10 students: 164
Why this matters:
- In Andhra Pradesh, agent relationships are central to recruitment success.
- In Maharashtra, there’s more room to grow direct channels, giving universities greater flexibility in how they engage students.
But the numbers also reveal something important about the agent ecosystem: a significant portion of agents work with small numbers of students. The key is recognising that smaller agents play an important role even if they don't drive volume.
Study Level Preferences: Where the Undergraduate Students Actually Are
India overall is heavily postgraduate taught: 80% PGT, 17% UG, and 3% PGR. But a few key states look very different.
Punjab stands out with a far more mixed profile:
- 52% PGT
- 36% UG
Haryana shows a similar shift:
- 65% PGT
- 29% UG
By contrast, several major states stay close to the traditional PGT-led pattern:
- Telangana: 95% PGT
- Kerala: 71% PGT (with 26% UG)
- Andhra Pradesh: 98% PGT
The takeaway: undergraduate and research demand is concentrated in just a few northern states, while most others continue to follow a strongly PGT-dominant profile.
Deposit Amounts: Higher Risk, Higher Stakes
Deposit levels vary far more across India than many expect.
Gujarat has the highest average deposit at £8,837, followed by Punjab (£7,801) and Haryana (£7,459), all states that are considered higher risk from a visa refusal perspective.
So do higher deposits reduce refusal risk? The picture is mixed.
- Gujarat has a very low refusal rate of 0.54%, which could suggest deposits play a role.
- But Punjab (3.09%) and Haryana (3.64%) still sit well above the national refusal average despite higher deposits, so deposits alone don’t solve the risk.
Year-on-year changes add more nuance:
- Punjab: deposits rose 8.15%
- Gujarat: up 9.90%
- Uttar Pradesh: deposits fell slightly by 2.87%
Looking only at students who successfully obtained visas, deposits were around 10% higher on average.
In higher-risk states, the difference was even more pronounced:
- Punjab: +16.6% (to £9,096)
- Haryana: +18.61% (to £8,848)
The takeaway: higher deposits often correlate with more committed applicants, especially in higher-risk states but they don’t eliminate refusal risk. It’s one signal among many, not a decisive factor on its own.
Age Profiles: Younger in the North, Older Everywhere Else
India overall is 29% in the 18-21 age bracket and 51% in the 22-25 bracket. But drill down by state and you'll see some significant variations.
Younger cohorts:
- Punjab: 38% aged 18-21
- Haryana: 43% aged 18-21
Both are well above the national average, reflecting the higher UG demand seen in these states.
Older cohorts:
- Uttar Pradesh: 65% aged 22–25
- Maharashtra: 59% aged 22–25
These states skew older than the national picture.
Why does this matter? Younger students (particularly in the 18-21 bracket) may need more support throughout the enrolment process, and their applications might require additional scrutiny from a compliance perspective. If you're recruiting heavily from Punjab or Haryana, your support infrastructure needs to account for a younger, potentially less experienced applicant pool.
Gender Balance: A Tale of Two Indias
India overall is 39% female, but the gender split varies dramatically by state.
More balanced states:
- Punjab: 49% female
- Kerala: 49% female
- Maharashtra: 45% female
- Karnataka: 45% female
These states are all well above the national average.
More male-dominated states:
- Telangana: 30% female
- Andhra Pradesh: 27% female
- Uttar Pradesh: 28% female
What's particularly interesting is that Punjab and Haryana, the two states we've consistently flagged as higher risk, show completely different gender patterns. Punjab is the most balanced state at 49% female, while Haryana sits at 37%, much closer to the India average.
There's no direct compliance correlation here, but it does tell you something about the nature of demand in each market. If you're specifically trying to recruit more female students from India, Punjab, Kerala, Maharashtra, and Karnataka are where you'll find them.
What This Means for Your Strategy
The data makes one thing clear: India isn’t one market. It’s a collection of distinct regional markets with different growth patterns, risk levels, demographics and recruitment behaviours. A single, national-level strategy is no longer enough.
Here are the key strategic considerations:
- Go where the growth is: Gujarat, Punjab and Telangana are driving the strongest year-on-year increases. If growth is a priority, these states should be at the centre of your planning.
- Balance growth with low-risk regions: Tamil Nadu, Karnataka, Maharashtra and Andhra Pradesh offer smoother progression and lower refusal exposure, providing stability alongside higher-growth states.
- Tailor your recruitment channels:
- Andhra Pradesh and Kerala: strongly agent-led, relationships matter.
- Maharashtra: more opportunity to build direct recruitment channels.
Different states require different approaches.
- Align your programme mix: UG demand is concentrated in Punjab and Haryana, alongside noticeably younger cohorts. PGT continues to dominate in most other states.
- Treat deposits as a signal, not a solution: Higher deposits often correlate with more committed applicants especially in higher-risk states, but they don’t eliminate refusal risk.
- Adjust support by age profile: Expect higher support needs in Punjab and Haryana, where students are younger (18-21). Other states, such as Uttar Pradesh and Maharashtra, tend to recruit older applicants, so support needs may look different.
- Build for gender balance: If diversity is a goal, Punjab, Kerala, Maharashtra and Karnataka offer the strongest female representation.
The bottom line? This analysis focuses on the ten largest Indian states on the Enroly platform, representing around 90% of all India-related volume. While the remaining states weren’t included due to lower numbers, the underlying patterns are likely to be similar. The message is clear: India isn’t a single market, it’s a collection of distinct regional recruitment landscapes, and treating it as such is now essential.
Anonymised Enroly data from the September 2025 intake